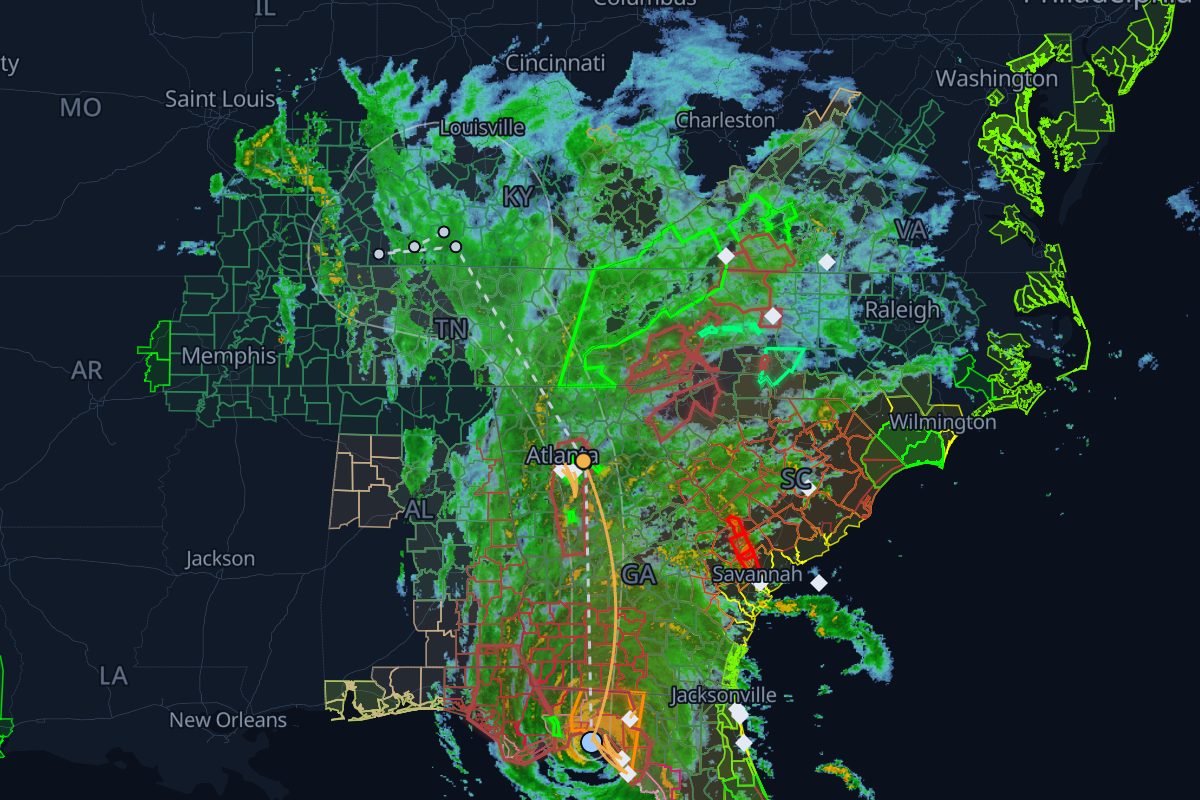
Replay · AL092024
Helene: the story
Sep 23, 15:00 UTC – Sep 28, 18:00 UTC · 35 NHC advisories. Radar, warnings, storm reports, ground stops and SEC filings, in order, with 1,058 links that show their evidence.
- 1,961 NWS warnings
- 2,324 storm reports
- 30 FAA airport programs
- 134 8-Ks naming Helene
- 1,058 rule-based links
- 1,371,453 customers out at the peak, in South Carolina
- 739 radar frames, 10 min apart
Chapter 1: Approach
Sep 23–25
- The replay opens on the first NHC advisory.Replay from here
Chapter 2: First impacts
Sep 26
- First 8-K naming Helene.
“OneWater Marine filed an 8-K on 2024-09-26 naming Hurricane Helene”
Replay from hereWhy linked
Chapter 3: Landfall
Sep 27
- Helene makes landfall about 10 n mi southwest of Perry, Florida as a category 4 hurricane (120 kt, 939 mb).Replay from hereNHC Tropical Cyclone Report: Hurricane HeleneNHC best track (HURDAT2)
Chapter 4: Inland
Sep 27–28
- Peak outages: 1,371,453 customers out of power in South Carolina. The most in one county: Greenville County, SC, 270,023 out (share unknown) at 22:00 UTC.Replay from here
Chapter 5: Aftermath
Sep 28–Nov 12
- The replay window ends: the storm has dissipated.Replay from here
- The aftermath: 133 8-Ks name Helene after the storm, the last on 2024-11-12.Replay from here
How we link records
| Rule | What it checks | Links |
|---|---|---|
| R4 solid | A storm report inside a warning polygon while it was in effect | 892 |
| R3 solid | An SEC 8-K that names the storm | 134 |
| R2 dashed | An airport program inside a warning that had been in effect for over 60 min (context) | 22 |
| R5 dashed | An airport program inside the storm's own tropical watch or warning | 5 |
| R1c solid | A weather airport program inside a convective warning or watch, within 60 min of issuance | 4 |
| R1o dashed | The same, for other hazards such as floods | 1 |
Solid lines mark rules that passed an independent check; dashed lines are context. Links are rule-based facts: each shows two records that overlap in place and time. How we know
Where this storm's data comes from
Every layer, the provider behind it and the period it covers.
| Layer | Provider | Period | Records |
|---|---|---|---|
| MRMS SeamlessHSR | NOAA/NSSL via Iowa Environmental Mesonet | Sep 23, 15:00 UTC – Sep 28, 18:00 UTC | 739 |
| NWS storm-based warning polygons | NOAA National Weather Service via Iowa Environmental Mesonet | Sep 23, 15:00 UTC – Sep 28, 18:00 UTC | 1,961 |
| NWS Local Storm Reports | NOAA National Weather Service via Iowa Environmental Mesonet | Sep 23, 15:00 UTC – Sep 28, 18:00 UTC | 2,324 |
| NHC advisories and best track | NOAA National Hurricane Center | Sep 23, 15:00 UTC – Sep 28, 18:00 UTC | 35 |
| FAA airport programs (ground stops and ground delay programs) | FAA Air Traffic Control System Command Center | Sep 23, 15:00 UTC – Sep 28, 18:00 UTC | 30 |
| SEC EDGAR 8-K filings | U.S. Securities and Exchange Commission | Sep 23, 15:00 UTC – Sep 28, 18:00 UTC | 134 |
| ORNL EAGLE-I | Oak Ridge National Laboratory | Sep 23, 15:00 UTC – Sep 28, 18:00 UTC | 995 |
- Radar: NOAA/NSSL MRMS SeamlessHSR, via the Iowa Environmental Mesonet (IEM), Iowa State University
- Warnings: NOAA/NWS, storm-based polygons via the Iowa Environmental Mesonet
- Storm reports: NOAA/NWS Local Storm Reports via the Iowa Environmental Mesonet
- Advisories and best track: NOAA/National Hurricane Center
- Airport programs: FAA Air Traffic Control System Command Center
- Filings: U.S. Securities and Exchange Commission EDGAR
- Power outages: Oak Ridge National Laboratory, EAGLE-I (CC BY 4.0)
- County boundaries: U.S. Census Bureau