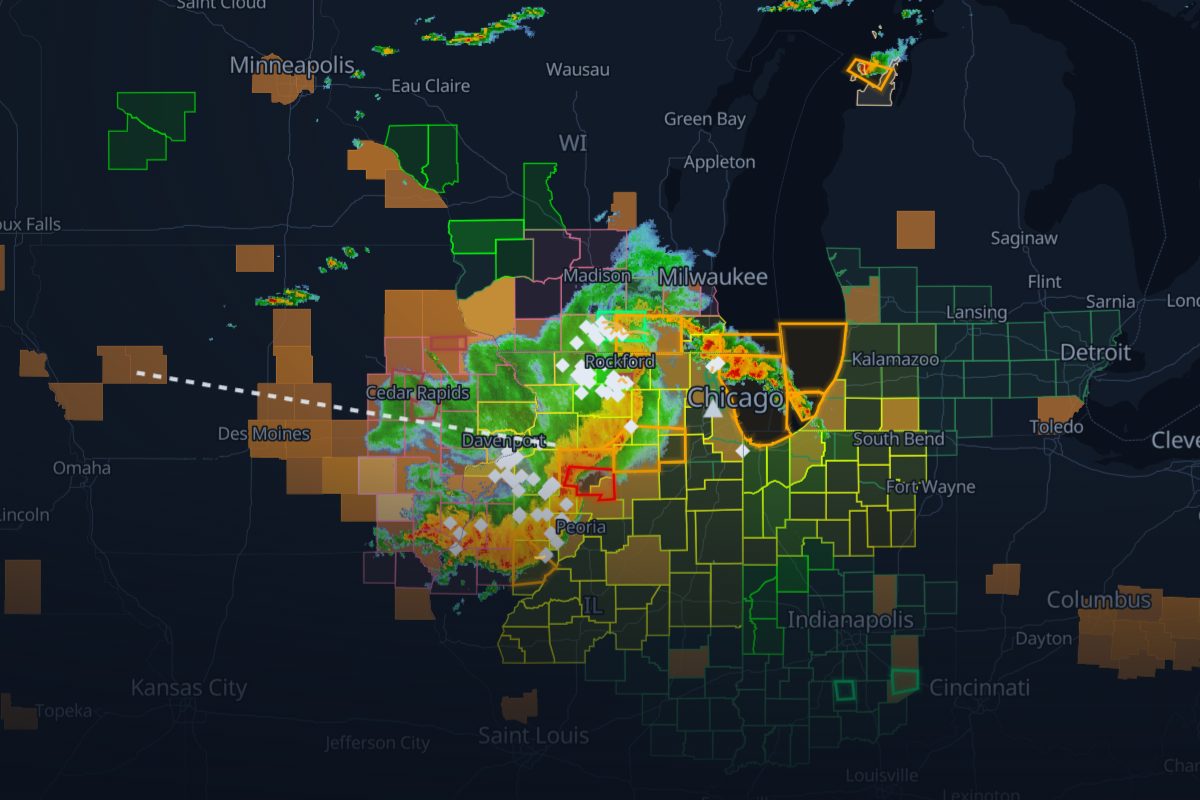
Replay · DE20240715
Chicago-area derecho: the story
Jul 15, 20:00 UTC – Jul 16, 07:00 UTC. Radar, severe thunderstorm and tornado warnings, storm reports and ground stops, in order, with 456 links that show their evidence.
- 368 NWS warnings
- 665 storm reports
- 3 FAA airport programs
- 1 derecho track (SPC)
- 456 rule-based links
- 390,878 customers out at the peak, in Illinois
- 331 radar frames
Chapter 1: Iowa
Jul 15
- The largest hail reported: 2.5 in at Vail, IA.Replay from here
- The derecho's line begins (Storm Prediction Center).Replay from here
Chapter 2: Illinois
Jul 15–16
- NWS Quad Cities IA IL, IL issues the first Tornado Warning.Replay from here
Chapter 3: Chicago
Jul 16
- The strongest measured gust: 105 mph at 3 S Camp Grove, IL.Replay from here
Chapter 4: Into the night
Jul 16
- Peak outages: 390,878 customers out of power in Illinois. The most in one county: Cook County, IL, 155,204 out (7% of its customers) at 04:15 UTC.Replay from here
- The derecho's line ends, 562 mi from where it began.Replay from here
How we link records
| Rule | What it checks | Links |
|---|---|---|
| R4 solid | A storm report inside a warning polygon while it was in effect | 445 |
| R2 dashed | An airport program inside a warning that had been in effect for over 60 min (context) | 5 |
| R1c solid | A weather airport program inside a convective warning or watch, within 60 min of issuance | 4 |
| R1o dashed | The same, for other hazards such as floods | 2 |
Solid lines mark rules that passed an independent check; dashed lines are context. Links are rule-based facts: each shows two records that overlap in place and time. How we know
Where this storm's data comes from
Every layer, the provider behind it and the period it covers.
| Layer | Provider | Period | Records |
|---|---|---|---|
| MRMS SeamlessHSR | NOAA/NSSL via Iowa Environmental Mesonet | Jul 15, 20:00 UTC – Jul 16, 07:00 UTC | 331 |
| NWS storm-based warning polygons | NOAA National Weather Service via Iowa Environmental Mesonet | Jul 15, 20:00 UTC – Jul 16, 07:00 UTC | 368 |
| NWS Local Storm Reports | NOAA National Weather Service via Iowa Environmental Mesonet | Jul 15, 20:00 UTC – Jul 16, 07:00 UTC | 665 |
| SPC derecho table | NOAA Storm Prediction Center | Jul 15, 20:00 UTC – Jul 16, 07:00 UTC | 1 |
| FAA airport programs (ground stops and ground delay programs) | FAA Air Traffic Control System Command Center | Jul 15, 20:00 UTC – Jul 16, 07:00 UTC | 3 |
| ORNL EAGLE-I | Oak Ridge National Laboratory | Jul 15, 20:00 UTC – Jul 16, 07:00 UTC | 503 |
- Radar: NOAA/NSSL MRMS SeamlessHSR, via the Iowa Environmental Mesonet (IEM), Iowa State University
- Warnings: NOAA/NWS, storm-based polygons via the Iowa Environmental Mesonet
- Storm reports: NOAA/NWS Local Storm Reports via the Iowa Environmental Mesonet
- Airport programs: FAA Air Traffic Control System Command Center
- Derecho path: NOAA/NWS Storm Prediction Center derecho table (Squitieri et al. 2026)
- Power outages: Oak Ridge National Laboratory, EAGLE-I (CC BY 4.0)
- County boundaries: U.S. Census Bureau