Replay · WS20220128
Blizzard of January 28–30, 2022: the story
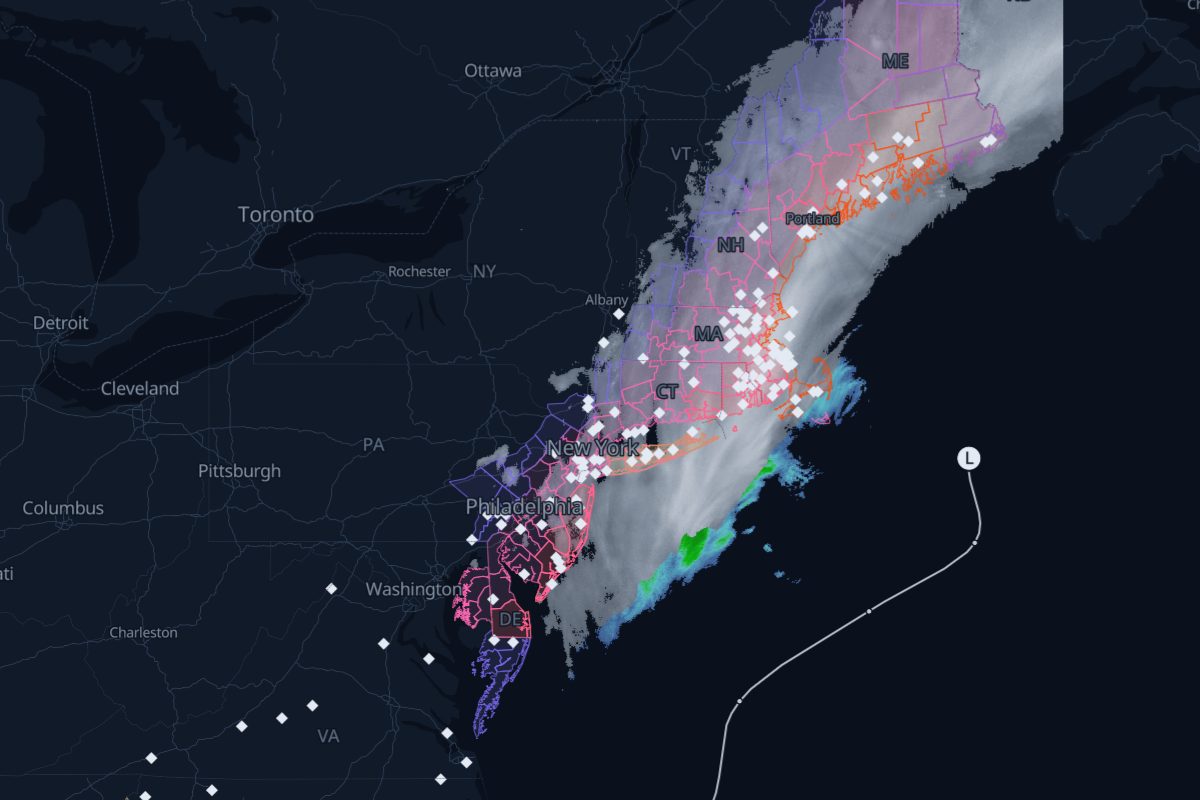
Jan 28, 00:00 UTC – Jan 31, 00:00 UTC. Radar showing snow and rain, winter warnings, storm reports and the surface low's track from the Weather Prediction Center, in order. NCEI's Northeast Snowfall Impact Scale rates it Category 1, Notable (NESIS 1.73), and ranks it 74th on its list.
- 63 NWS warnings
- 3,437 storm reports
- 18 WPC surface-low analyses
- 4 FAA airport programs
- 119,864 customers out at the peak, in Massachusetts
- 433 radar frames, 10 min apart
Chapter 1: First warnings
Jan 28–29
- NWS Wakefield, VA issues the first Blizzard Warning.Replay from here
Chapter 2: The bomb
Jan 29
- Peak outages: 119,864 customers out of power in Massachusetts. The most in one county: Barnstable County, MA, 85,305 out (72% of its customers) at 20:30 UTC.Replay from here
- The strongest wind reported: 81 mph at 5 SE Yarmouth, MA.Replay from here
- Bombogenesis: the low's pressure has fallen 38 mb in 24 hours, to 972 mb.Replay from here
Chapter 3: At its deepest
Jan 30
- The largest snow report: 30.9 in at 1 W Stoughton, MA.Replay from here
- The low is at its deepest: 968 mb.Replay from here
Where this storm's data comes from
Every layer, the provider behind it and the period it covers.
| Layer | Provider | Period | Records |
|---|---|---|---|
| MRMS SeamlessHSR | NOAA/NSSL via Iowa Environmental Mesonet | Jan 28, 00:00 UTC – Jan 31, 00:00 UTC | 433 |
| NWS storm-based warning polygons | NOAA National Weather Service via Iowa Environmental Mesonet | Jan 28, 00:00 UTC – Jan 31, 00:00 UTC | 63 |
| NWS Local Storm Reports | NOAA National Weather Service via Iowa Environmental Mesonet | Jan 28, 00:00 UTC – Jan 31, 00:00 UTC | 3,437 |
| WPC coded surface bulletins | NOAA Weather Prediction Center via Iowa Environmental Mesonet | Jan 28, 00:00 UTC – Jan 31, 00:00 UTC | 18 |
| NOHRSC snowfall | NOAA National Operational Hydrologic Remote Sensing Center | Jan 28, 00:00 UTC – Jan 31, 00:00 UTC | |
| FAA airport programs (ground stops and ground delay programs) | FAA Air Traffic Control System Command Center | Jan 28, 00:00 UTC – Jan 31, 00:00 UTC | 4 |
| ORNL EAGLE-I | Oak Ridge National Laboratory | Jan 28, 00:00 UTC – Jan 31, 00:00 UTC | 643 |
- Radar: NOAA/NSSL MRMS SeamlessHSR, via the Iowa Environmental Mesonet (IEM), Iowa State University
- Warnings: NOAA/NWS, storm-based polygons via the Iowa Environmental Mesonet
- Storm reports: NOAA/NWS Local Storm Reports via the Iowa Environmental Mesonet
- Storm track: NOAA/NWS Weather Prediction Center coded surface bulletins, via the Iowa Environmental Mesonet
- Airport programs: FAA Air Traffic Control System Command Center
- Filings: U.S. Securities and Exchange Commission EDGAR
- Snowfall: NOAA/NWS National Operational Hydrologic Remote Sensing Center (NOHRSC)
- Power outages: Oak Ridge National Laboratory, EAGLE-I (CC BY 4.0)
- County boundaries: U.S. Census Bureau